Usage & data inputs
Script inclusion via comparison editor
To annotate the various PFAS information to each profile, include the
Comparisons workflow step in the red section of
the
Workflow options tab and download the script
→ PfasProfileFilter.r
and place it as-is in the
scripts folder of your enviMass project.
Then, press button
Settings → Apply.
Next, navigate to the tab
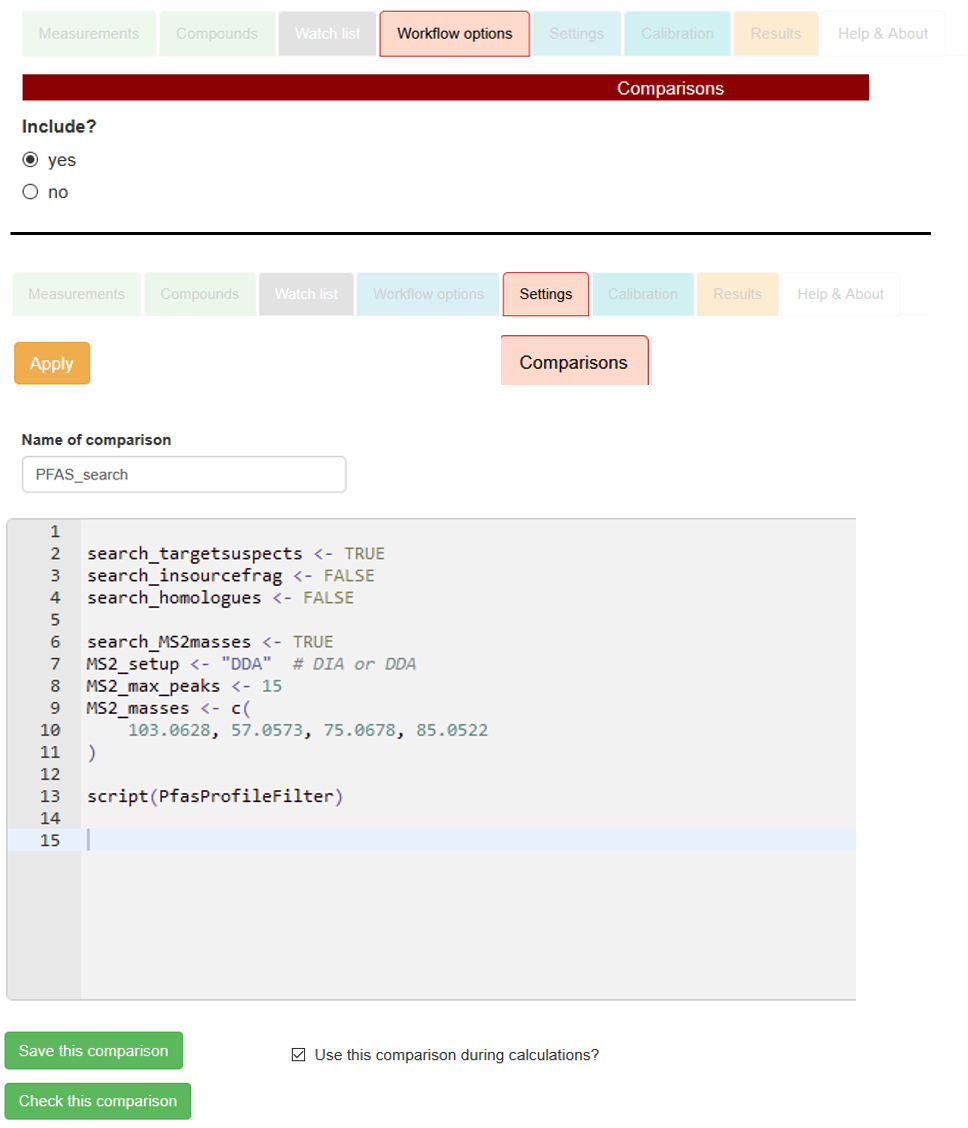
Settings → Comparisons. Therein, set up a new comparison by defining the
Name of comparison (e.g., PFAS_search),
and by including the following specifications in the comparison editor, as exemplified with the right-sided screenshot:
search_targetsuspects: Whether to annotate target/suspect screening matches,
TRUE or FALSE.
search_insourcefrag: Whether to annotate matches with co-eluting MS1 in-source fragments,
TRUE or FALSE.
search_homologues: Whether to annotate homologue series for profile peaks,
TRUE or FALSE.
search_MS2masses: Whether to annotate MS2 fragments of the profile peaks,
TRUE or FALSE.
MS2_masses: m/z values for MS2 fragments (R vector <- c() definition
with comma-separated numeric mass values).
mztol: MS2 mass accuray [mmu]. Is being set to 2 mmu if not defined here.
peakshape_for_methods: for which MS2 method
a MS2 vs MS1 peak shape correlation should be run (R vector <- c() definition with comma-separated
quoted characters).
Can be DIA and/or default, but not DDA.
If not defined, no peak shape correlation will be run for any MS2 method, which might sometimes be
the intended option.
script(PfasProfileFilter): include as-is to embed the script.
For setting up the comparison, adhere to the R syntax (i.e., assignment of
TRUE / FALSE with arrows, specification of vector with
<- c())
as shown on the screenshot. Include the script itself with the final command
script(PfasProfileFilter).
Finally, use the button
Save this comparison to make your specifications permanent.
Depending on which of the four annotations that you have now set to TRUE, check each of the additional data inputs
as described below:
→ Comparison text to copy and paste:
				search_targetsuspects <- TRUE;
				search_insourcefrag <- TRUE;
				search_homologues <- TRUE;
				search_MS2masses <- TRUE;
				MS2_masses <- c();
				mztol <- 2;
				peakshape_for_methods <- c("DIA", "default");
				script(PfasProfileFilter);
→ general information on comparisons
1. PFAS-targets & -suspects
Relevant when comparison parameter
search_targetsuspects is set to
TRUE.
Add your
→ target and suspect compounds
in the regular way with the tab
Compounds → Targets,
where you may also define very large RT tolerances for your individual suspect compounds to cover the full elution range.
Enable the target screening step in in the green
Compounds section of the tab
Workflow options,
and again press the
Settings → Apply button.
In addition, and provided you know that certain MS2 fragment masses can be related to certain targets/suspects, you may insert their m/z-values into the field
Fragments of the target list, to be found in tab
Compound - Targets.
To search for these during screening, also enable
Settings → Screening → Targets & Suspects → Screen for MS2 fragments?
2. In-source fragments
Relevant when comparison parameter search_insourcefrag is set to TRUE.
Get the molecular formulas of any PFAS MS1 in-source fragments of interest (e.g., C5F9, C5F9, etc).
Then simply add these candidates to the target list of above point 1, but make sure to define their tag1 entry in this list as fragment.
Logically, avoid doing so for the targets and suspects, which should have tag1 set to FALSE or anything else but fragment.
Without any targets or suspects at hand, you may also set up a list that only consists of these in-source fragments.
Specify any adducts of interest in Settings → Screening → Targets & Suspects / Adducts,
then press the Apply button.
The relevant script step checks each profile to have other co-eluting and peak-shape correlated profiles which have screening matches for these in-source fragments.
Profiles with direct screening matches for in-source fragments themselves are automatically excluded from the scripting results.
Beware that some in-source fragments cannot form certain adducts. For instance, M-H cannot be formed for in-source fragment C5F9.
Apart from what can be defined in Settings → Screening → Adducts for all compounds, compound-specific adducts can also be defined in the
main_adduct column of the target list.
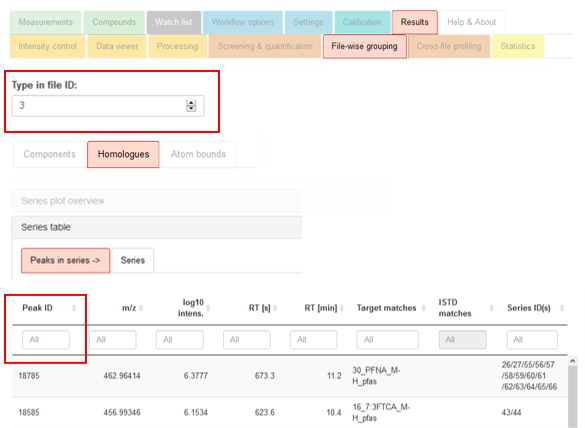
3. Homologue series
Relevant when comparison parameter search_homologues is set to TRUE.
To use the homologue series annotation, enable the homologue series detection in in the black File-wise componentization section of the tab Workflow options.
Specify series detection parameters in the tab Settings → Componentization → File-wise componentization → Homologue series detection,
above all any PFAS-specific series units such as CF3, CF2 or C2F4.
Then press the button Settings → Apply.
(If you already know that certain targets / suspects must be present as homologue series, you can include this information directly in the target list.
Namely, add the relevant series unit molecular formula into the field homol_unit of a compound.
Then, to ONLY annotate target/suspect screening information to the profiles when the screened peaks are also part of such series and their specified units,
enable Only tag screening results to profiles if ... in the advanced parameter section of the mentioned homologue series settings.)
4. MS2 fragments
Relevant when comparison parameter
search_MS2masses is set to
TRUE and any
MS2_masses can be specified.
The PFAS script checks for at most 15 of the most intense peaks of each
MS2 method in a profile for the presence of the
MS2_masses.
This always includes a filtering of MS2 fragments in overlapping mass extraction windows and, depending on
peakshape_for_methods,
the chromatographic peak shape correlation between MS1 precursor and these MS2 fragments.
To use this annotation, and provided you have molecular formulas for your MS2 fragments of interest, convert these to m/z values for the
relevant ESI adducts of interest, e.g., with
→ this tool.
Use these fragment m/z values for the specification of the
MS2_masses in the comparison editor
(as an R vector with comma-separated numeric m/z values, cp. above section on script inclusion to view the correct coding).
Please mind to not use neutral masses for this.
Furthermore, make sure the
MS2 extraction is set to
yes in the
Workflow options.
Apart from
mztol (defaults to 2 mmu if not defined in the comparison editor) and
peakshape_for_methods
(if not defined, no peak shape correlation will be run), a few other parameters can be optionally added to the comparison editor:
max_scans_default, max_scans_DIA, max_scans_DDA: the +/- maximum number of MS2 scans centered around the MS1
peak apex scan over which to extract fragments (this number subsumes all MS2 scans between one MS1 scan and the next MS1 scan).
If not defined otherwise, this defaults to 15 (DIA, default) and 0 scans (DDA).
Set to 0 to only extract at the MS1 peak apex scan.
correlation_min_data_points:
The minimum number of data points (i.e., MS2 scans) for the Pearson peak shape correlation used for peakshape_for_methods.
Defaults to 10 if not defined otherwise.
If not reached, fragments are removed.
mincor_peakshape:
Threshold for the Pearson peak shape correlation.
Defaults to 0.8 if not defined otherwise.
The PFAS script does not let you filter for different
Scan types for each
MS2 method, in contrast
to the general workflow MS2 processing. The script simply pools the different
Scan types of each
MS2 method
in case several exist.
More information on workflow MS2 processing, including the peak shape correlation, can be found in this
→ tutorial.
Other steps
Of course, you may likely have to combine the described comparison script calculation with other relevant workflow steps,
such as the blind peak annotation or the ISTD screening.
Foremost, the Profile componentization in conjunction with the File-wise peak-grouping
(cp. Workflow options) allows to filter redundant component masses in the profile filtering step described further below.